Inside operum.ai: How a Desktop App Orchestrates an AI Agent Team
The architecture behind operum.ai — Tauri, Rust, SvelteKit, file-based IPC, and a workflow arbiter that keeps 6 AI agents coordinated without a cloud backend.
People keep asking how operum.ai actually works. I’ve been sharing metrics and philosophy, but not the engineering under the hood.
This post fixes that. Here’s the architecture of a desktop app that orchestrates 6 AI agents — built with Tauri, Rust, and SvelteKit — without a cloud backend.
Why Desktop, Why Local
The first decision was the most consequential: no cloud.
AI agent orchestration platforms typically run server-side. Your code goes up, agent instructions go up, coordination happens on someone else’s infrastructure. For solo founders and small teams working on proprietary code, that’s a hard sell.
operum.ai runs entirely on your machine. Agents read your local code, write to your local repo, and coordinate through your local filesystem. The only network calls are to the LLM API (your existing subscription) and GitHub (for issue/PR management).
This means:
- No data residency questions. Your code never leaves your machine.
- No per-seat pricing. It’s your hardware running your agents.
- No latency tax. Agent-to-agent communication is filesystem-speed, not network-speed.
The Stack
Tauri v2 wraps the whole thing. Rust backend for performance-critical operations — agent process management, file watching, persistent queues. SvelteKit frontend for the dashboard and real-time UI. Vanilla CSS because there’s no reason to ship a framework for styling.
Why Tauri over Electron? Mostly binary size and resource usage. When you’re running 6 Claude Code processes alongside the app, you want the orchestrator to be as lightweight as possible. Tauri’s Rust core gives us native performance for the parts that matter — file system watchers, process lifecycle management, IPC parsing — while SvelteKit handles the UI with minimal overhead.
The key Rust modules:
| Module | Responsibility |
|---|---|
| agents | Process lifecycle — spawn, monitor, restart Claude Code sessions |
| ipc | File system watcher for trigger/response files |
| arbiter | Workflow orchestration — queue, health checks, routing |
| github | Bidirectional sync with issues, PRs, and labels |
| knowledge | Project context and goals that agents share |
| teams | Multi-team management for different projects |
Two Layers of Coordination
This is the part people are most curious about. Agent coordination happens at two distinct layers:
Layer 1: File-Based IPC
I wrote about this pattern in From SSH Sessions to Autonomous Agent Teams. The core idea is dead simple: agents communicate through files.
team-directory/
├── agents/
│   ├── pm/           # Each agent gets a directory
│   ├── architect/    # with its own CLAUDE.md
│   ├── engineer/     # defining role and scope
│   ├── tester/
│   ├── marketing/
│   └── community/
└── shared/
    ├── triggers/     # Inbound: "here's your next task"
    └── responses/    # Outbound: "here's what I did"
When the PM agent decides the Architect should review a new feature, it writes to shared/triggers/architect.trigger. When the Architect finishes, it writes to shared/responses/architect.response. No message queues. No Redis. No WebSockets.
Why files? Because every tool in the Unix ecosystem can read and write files. Claude Code can do it. Shell scripts can do it. Cron can do it. The Rust backend’s notify crate watches for changes in real-time. Files are the lowest-common-denominator IPC mechanism, and for this use case, that’s exactly right.
Layer 2: The Workflow Arbiter
File-based IPC handles the “what.” The arbiter handles the “how reliably.”
The arbiter is a Rust service that sits between the file system events and the actual workflow routing. When a response file changes, the raw event goes through several stages before anything happens:
File change detected
    → Event deduplicated (filesystem watchers fire multiple events per write)
    → Response parsed and classified
    → Routed to next stage in pipeline
    → Persisted to disk (WAL-based queue)
    → Frontend notified via Tauri events
The persistent queue is the critical piece. If the app crashes between an agent finishing work and the next agent being triggered, the queue picks up exactly where it left off on restart. No work lost, no duplicate dispatches.
The arbiter also handles health monitoring. If an agent hasn’t produced output within a configurable window, it gets flagged. If an agent’s process exits unexpectedly, the arbiter can restart it with session continuity. These aren’t fancy ML-powered decisions — they’re straightforward state machine transitions. But they’re the difference between a demo and a production system.
The Pipeline
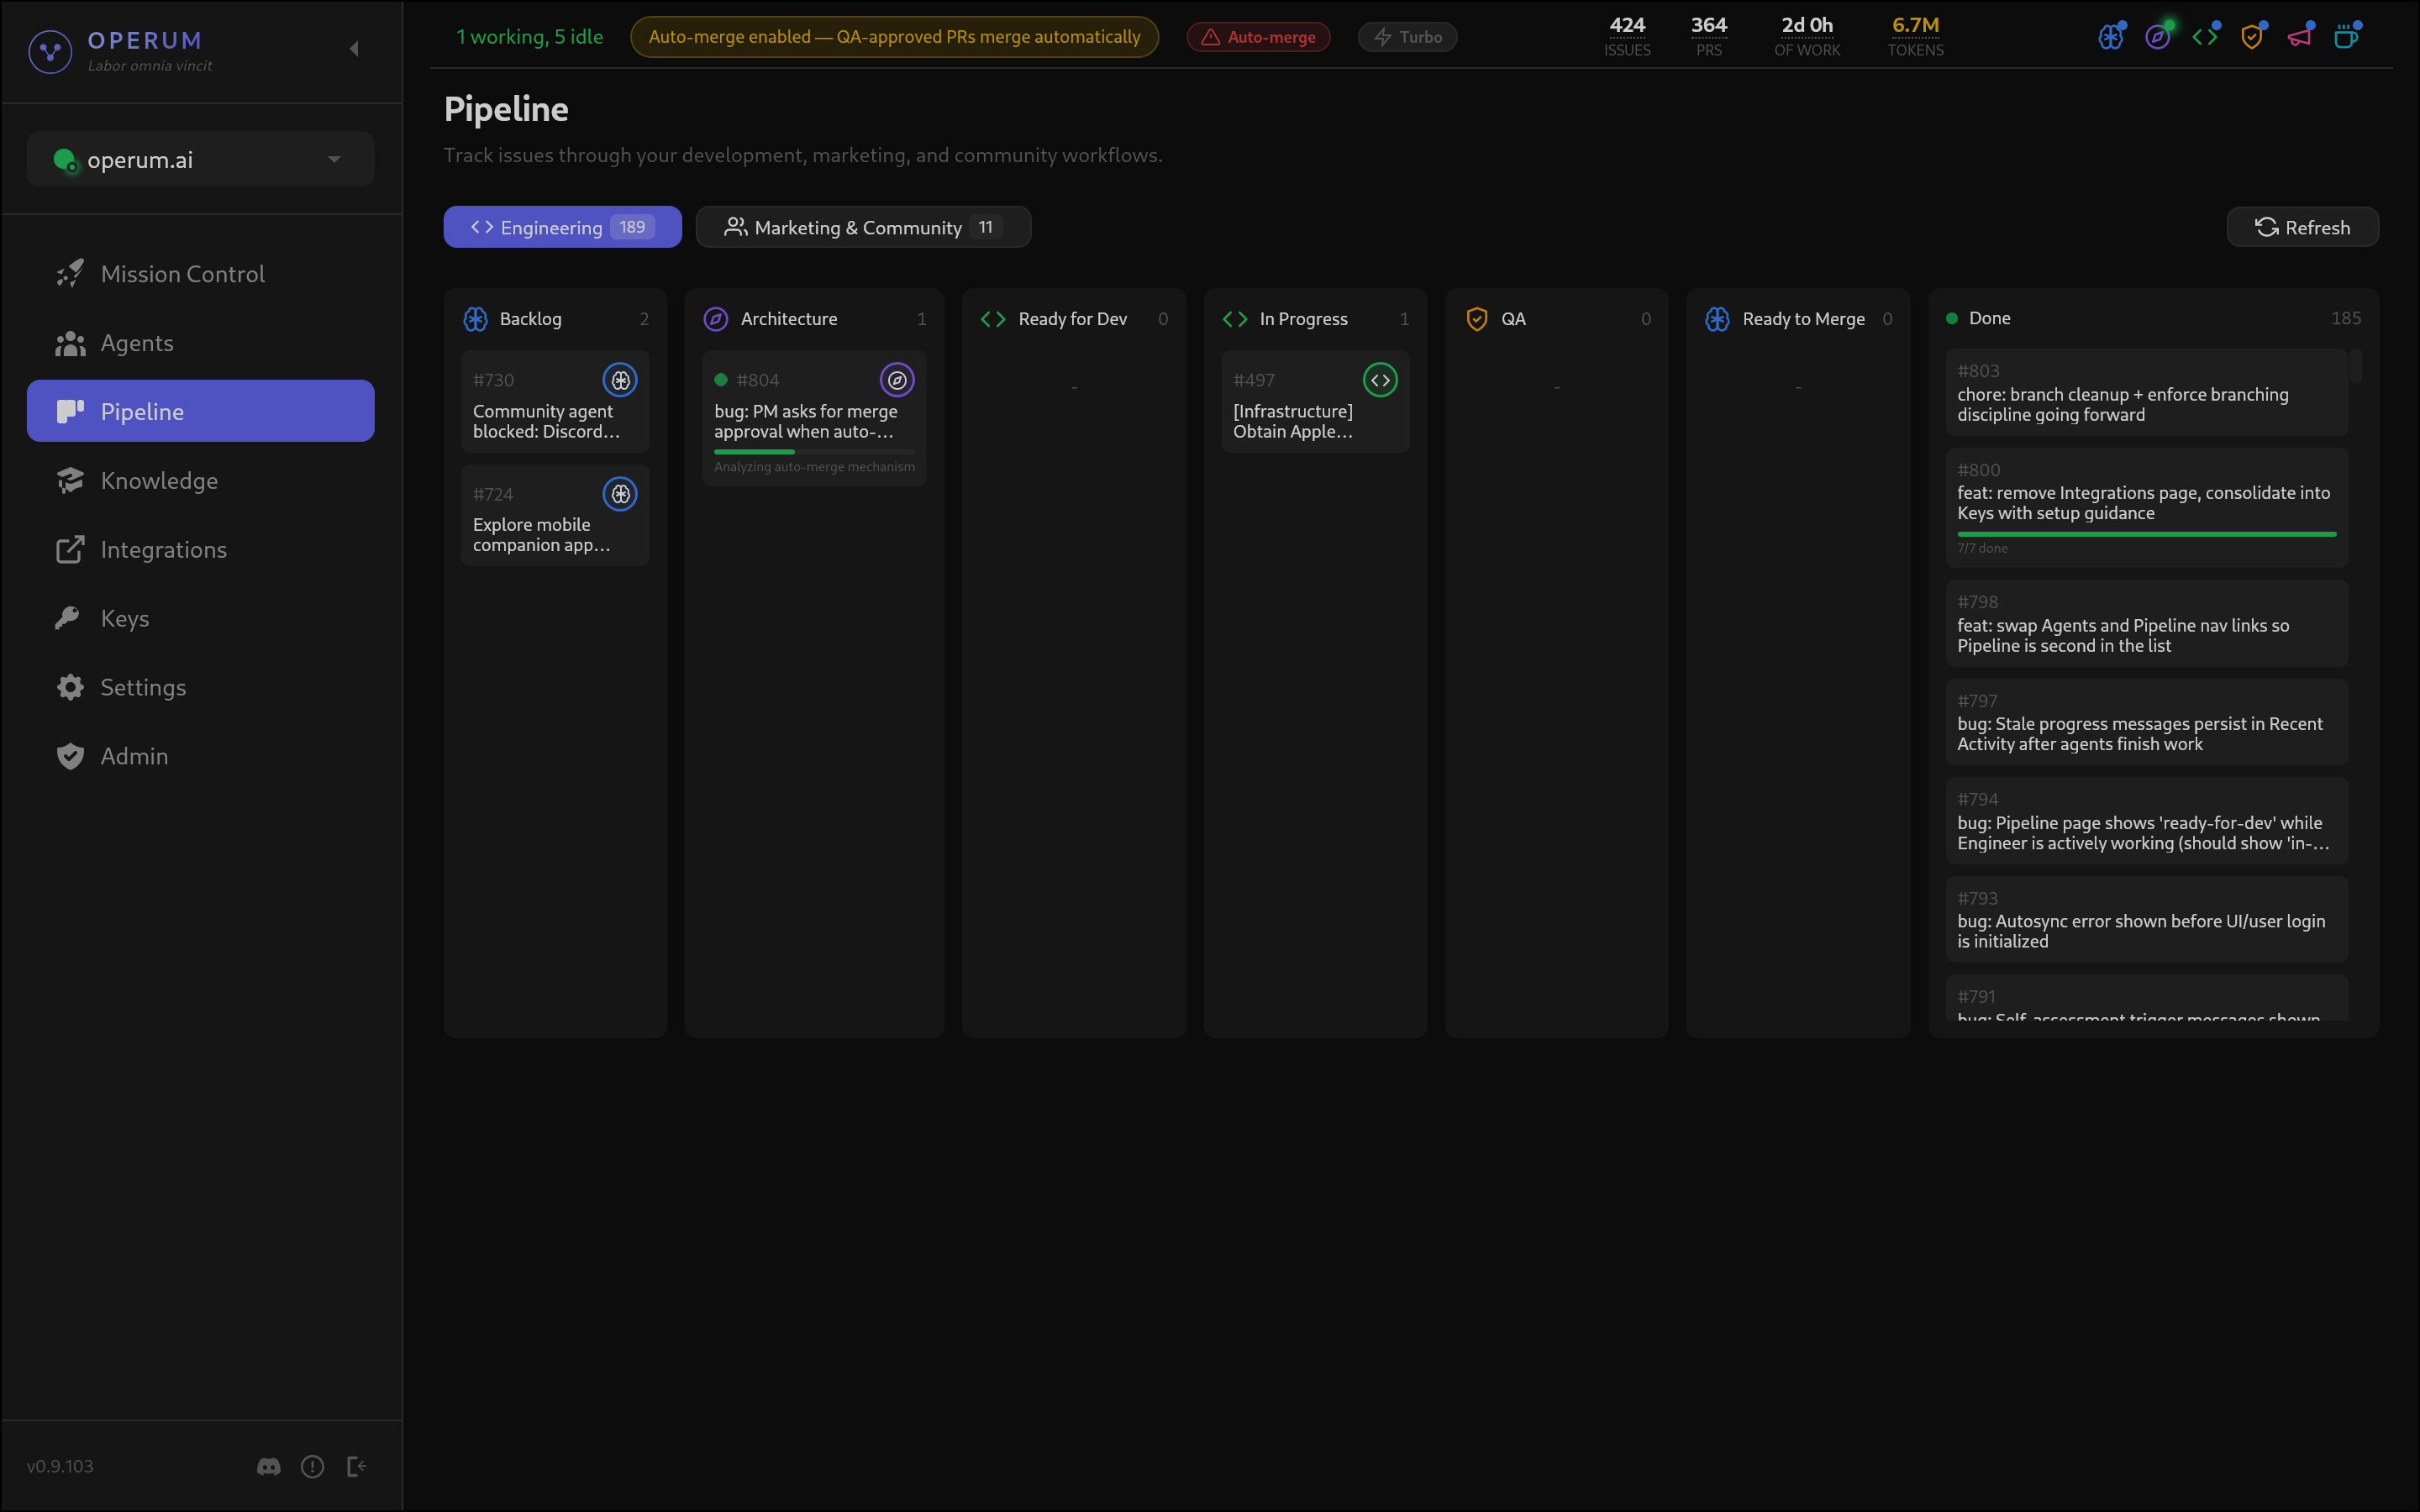
Work flows through a defined pipeline, and the UI visualizes it in real-time as a kanban board:
New Issue
  → PM triages and assigns
    → Architect designs approach
      → Engineer implements (creates PR)
        → Tester validates
          → PM requests human approval
            → Merge
Each transition is tracked through GitHub labels. When the Architect finishes reviewing, the system moves the issue from needs-architecture to ready-for-dev. When the Engineer opens a PR, it moves to in-progress. The labels are the source of truth — you can see pipeline state directly in GitHub, even without the operum.ai dashboard open.
This means operum.ai doesn’t replace your existing workflow. It layers on top of GitHub. Your issues are still issues. Your PRs are still PRs. The agents just move them through the pipeline faster than you could manually.
The PM as Orchestrator
One design choice that made everything work: the PM agent is the single point of coordination.
Other agents don’t talk to each other directly. Engineer doesn’t trigger Tester. Marketing doesn’t ping Community. Everything routes through the PM, who maintains the global view of what’s happening and what needs to happen next.
This mirrors how effective human teams work. You don’t want every engineer pinging every QA person directly. You want a coordinator who understands priorities, dependencies, and sequencing.
The PM runs on two clocks:
- Event-driven — Responds to completed work immediately via the arbiter
- Periodic self-assessment — Scans for anything that fell through the cracks
The periodic check is the safety net. Event-driven coordination handles 95% of cases, but the PM’s regular scan catches edge cases — a response that wasn’t processed, an issue that’s been stuck too long, an agent that needs reassignment.
Real-Time Dashboard
The frontend is where the architecture becomes tangible:
Mission Control shows agent status, current tasks, and a chronological activity feed. Every agent action gets logged — task assignments, completions, blockers, PRs created, errors encountered. The feed updates in real-time through Tauri’s event system.
Pipeline View is a kanban board where cards move automatically. When an agent completes a stage, the card animates to the next column. You see work flowing through the system without refreshing.
Agent Logs let you drill into any agent’s reasoning. What did the Architect consider? What did the Engineer change? Full transparency into the autonomous decisions being made.
The data lives in a local JSONL journal — append-only, crash-safe, and trivially parseable. No database. The journal survives restarts and gives you a complete audit trail of everything your agent team has done.
What I’d Do Differently
A few lessons from building this:
Start with the arbiter, not the agents. I built agents first and added reliability later. In hindsight, the orchestration layer should come first because unreliable coordination makes even good agents useless.
GitHub labels are great until they’re not. Labels work well for linear pipelines but get messy with parallel workstreams. I’m exploring richer state tracking for v2.
File-based IPC has a ceiling. For a 6-agent team on one machine, files are perfect. For distributed agents across machines, you’d want something with better delivery guarantees. But premature distribution is worse than premature optimization — start local, scale when you actually need it.
What’s Next
operum.ai is preparing for public launch. The architecture described here is what’s running in production right now — the same system that went from 17 issues to 194 in two weeks.
If you want to try autonomous agent orchestration on your own projects, download operum.ai — it’s available now for macOS and Linux.
Previous in series: From 17 Issues to 194: Watching an AI Agent Team Scale Up
Building with AI agents? Follow the journey on LinkedIn or Twitter.